In order to be effective in your business, you need to understand what you do and how you and your team and organization fit into the flow of the business. In other words: “What am I doing and why am I here?” This information is needed when you join a business team in order to have proper situational awareness. It is also needed when your business is being analyzed in pursuit of improvements or in cases of a business plan pivot. Without proper knowledge of the business goals, end-to-end processes, flow, and customer, there is always a risk that misinformed assumptions, under-informed decisions, and wasteful plans will result. If you know your place in the context of the business, you will be better prepared to make significant contributions with a positive impact.
In this article, I will lay out a way to understand your business using a variety of diagrams and charts. This method falls under the concept known as “business process modeling”. It requires doing your homework, but the advantages gained from the exercise will outweigh the effort. The perspective will be focused on you and your place in the business, and the method can be extended to understand all aspects of the business.
We begin by working at a high level, understanding how your department and team fits into the larger context, and then narrow down into an understanding of the functional relationships and process details. Finally, an understanding of the customer, business goals, activities, partners, resources, and revenue streams is required to fill out the perspective. With all of this information, you can lay out a comprehensive groundwork of understanding to be used for a variety of purposes.
For the examples in the diagrams shown in this article, I will assume that the entity in which you work is software sales and development, with the initial context focusing on the R&D team. This is only for example, and the examples are simple and not comprehensive. You can replace the entities with whatever is true for your team and your business.
Start Large: Context Diagram
Context diagrams show how your team fits into a bigger context. The diagram provides perspective on how you interact with the larger world of your business, and how you relate to the rest of the systems. Keep the diagram simple. Show the organization where your business control resides in the center of the diagram, with arrowed lines to other entities which are beyond your direct control. Keep things simple. Details for processes will be reflected in subsequent steps of the modeling process.
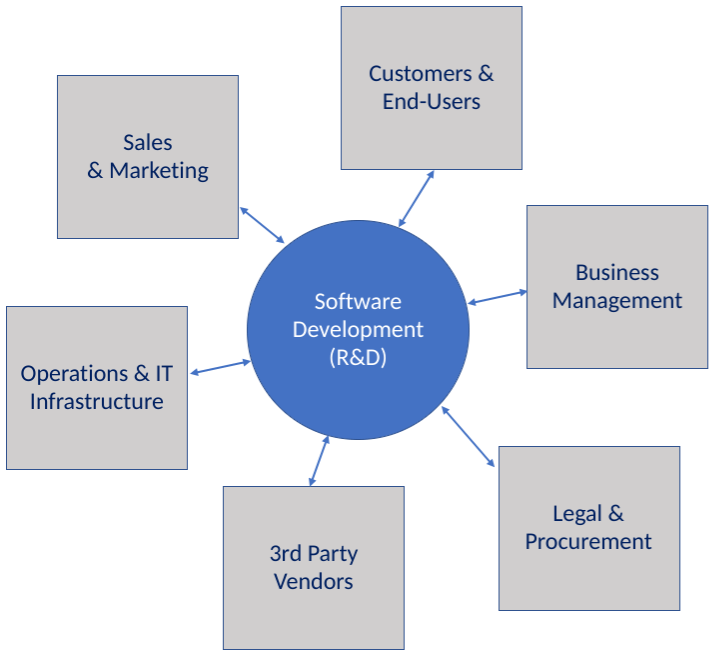
Gathering the information in this step, as well as in subsequent steps, requires open communication and transparency of information within the business. If you are unfamiliar with your business structures, you will need to talk to your peers and mentors to gather data. Always validate the information with your co-workers. Never assume.
Analyzing Inputs and Outputs: Functional Flow Diagram
The functional flow diagram provides more details on top of the context diagram as to who performs specific actions. This does not show how the action is taken. Functional flow diagrams show the various activities to complete a task. Create separate flow diagrams which cover the relationships established in the context diagram, as appropriate. Organization charts and hierarchy diagrams can be used to help formulate these diagrams.

Even if the process which the diagram represents seems complicated, try to keep the diagram and entities as simple as possible. Use circles for each functional area, and then use arrows for relationships. Labels on the arrows identify what is exchanged in the process (again, not how). Validate the diagram with your peers. Set up short meetings to review and discuss with your co-workers, and make corrections and adjustments as you learn. Don’t be afraid to ask questions. Asking questions, even if they seem “stupid”, show that you have an interest and passion to understand and improve yourself and the business.
Swim Lanes: Cross Functional Flow Diagrams
Also known as a swim lane diagram, the cross functional flow diagram shows a process flow from start to end, and how the flow crosses and interacts with other functional areas. Typically each swim lane is a functional area or actor in the process, and sub processes are provided in boxes in the swim lane. The diagram will show the main path of the process under typical conditions. “Alternate flows” can be provided as extensions on the main flow, for example to handle exceptional scenarios. The lanes should be consistently horizontal or vertical, whichever you prefer.

As I mentioned in the introduction to this article, these examples shown here are very simple. In your real cross functional flow diagrams, be careful not to go into too much detail. If you think a series of steps can be grouped together, create this grouping as a sub-process. As always, validate what you are documenting with your peers.
Note that there are some icon standards for showing processes and sub-processes, and using arrows and lines. This gliffy page has some examples of icons you can use.
Detail the Processes: Flowchart Diagram
At this point you will have processes and sub-processes expressed which will need to be further detailed. This is a low level of detail, shown in a sequence. You should be able to easily trace back to the cross functional flow diagram from the flowchart. There are no swim lanes in a flowchart. Go to the level of detail you require, however keeping a flow series on one or two pages is ideal. In many cases, it is good to focus on only a single actor and functional area.
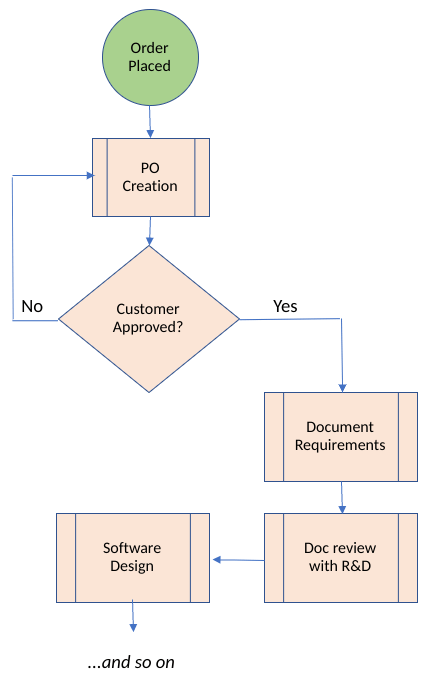
There are conventions used to represent icons and steps in the process. See the gliffy link above in the cross functional diagram section, or check out this Wikipedia page.
Business Model Canvas
Now that you have an evolved and detailed view of the business processes and functional relationships, you will now need to expand beyond processes. The Business Model Canvas provides a simple one-page view of many aspects of a business. Although it does not lay out a process as we saw above, the canvas will provide a comprehensive perspective to fill out your knowledge of the business at large. Watch this short video about this Model, and a template example is provided below with questions that can be used to fill out the form.

A typical order for filling out the template is 1) Customer Segments, 2) Value Proposition, 3) Channels, 4) Customer Relationships, 5) Revenue Streams, 6) Key Resources, 7) Key Activities, 8) Key Partners, 9) Cost Structure. Fill out the form as best as you can. Depending on your position and the size of the company, its understandable that some of this information may be outside of your functional area or domain and may be challenging to obtain. Again, check with your peers and co-workers for advice and information.
[Side note: You will see “minimum viable product” mentioned in the above model under Value Propositions. See my blog Minimum Viable What? for my thoughts on this concept.]
Wrapping Up
Before endeavoring to gather all of this information discussed here, check if there might already exist some level of this information. There is no reason to waste time gathering data and notes if it already exists. However, if you are someone who learns best by doing, spending the time to research may just be the right choice for you. If something already exists, even in some partial form, you can use it as a starting point to begin your own research.
If you take the time to pull together this information, not only will it put you at an advantage to help grow and improve your business, but you will have invaluable information that can be shared with your co-workers. It will be much appreciated by your peers. Good business requires continual improvement, transparency, and a clear understanding of objectives and vision, and how processes fit (or don’t fit!) with the vision.
Use these steps no matter what your background or position is. It is very helpful if you are new to the company or team, but even seasoned employees will find that there are areas they know little about or require improvement. Also, it does not matter what part you play in the business, from technical, sales, business management, people management, training, logistics, executives, and so on. The more we know, the better we can all play a part in improving our business.
